


Everyone is familiar with how bird atlases produce maps of how birds are distributed over space. But in addition to studying where birds are, we can also study when they occur and are performing various breeding behaviors in Wisconsin.
The uses of data on the timing of bird occurrence and behavior are as varied as this year’s Wisconsin Wildlife Phenology Calendar and these cool eBird STEM maps.
Here at atlas central, we’ve been plotting year 1 data to explore bird and breeding code occurrence over time in Wisconsin.
One thing we often get asked is: “I’ve already confirmed Northern Cardinal in my block, should I continue to report them?” As you’ll see from these charts, the answer is YES. All data are valuable, and subsequent observations help to inform our knowledge of when a species occurs in the state, what it’s up to, and how detectable it is (which can help inform population models).
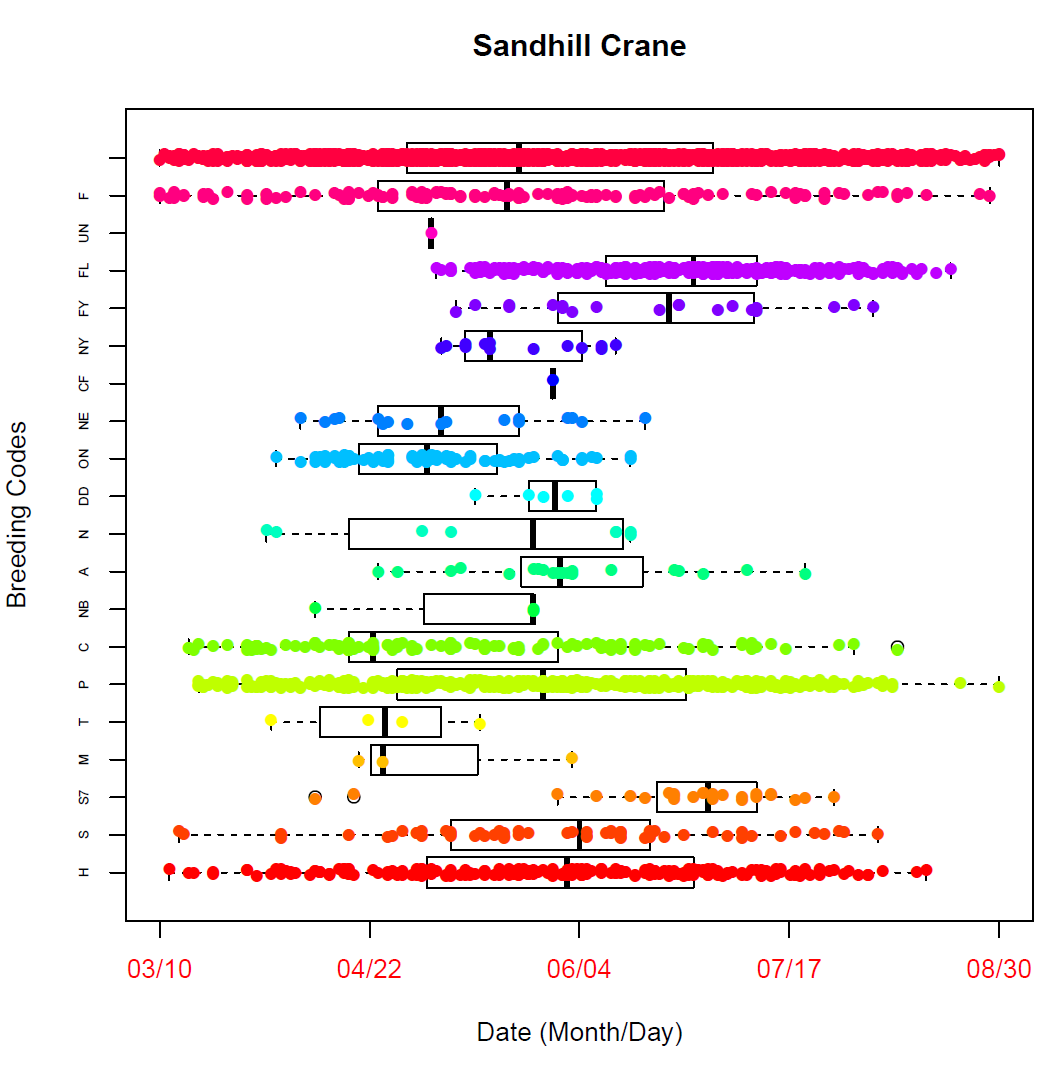
 Here’s an example, with day of year along the bottom, and atlas codes on the left side. Observations with no breeding code (“Observed” only) are across the top. You can see Rose-breasted Grosbeaks start arriving in early May, and soon after start receiving low-level codes (don’t forget that early in the season you should be wary of possible migrants), and then later, some of the probable and confirmed codes. From the first season’s data you can see that most nest-building occurs from mid-May through mid-June, nests were active until mid-July, and fledged young were seen through August. This is raw uncorrected data at this point, so some of the dots that are outlying for their code may require a double-check.
The black rectangles and lines behind the dots are box plots, a statistical tool that helps visualize the distribution of data (learn more about box plots here). The center dark line is the median date birds were reported for that code and the ends of the box show the upper and lower quartile (25% of records are outside the box on each side of it). If records are outside the long dashed “whiskers” they can be considered outliers. (Of course you have to consider how much data there is for each breeding code. For species with a lot of points in a code, you can put some faith in the boxplot, but you can also see that in some cases, a code for a species just won’t have much data, and the boxplot is of limited usefulness).
The patterns in these plots reveal differences in the natural history of species.
As you can see, some species arrive early in the state:
 Some species arrive late:

Some species have a drawn-out breeding period:

Some species breed quickly and then leave the state:

And some species occur in summer, but don’t breed here:

These are only records from eBird Atlas Portal checklists, and only through August 2015, so we are not yet able to visualize late fall records (these data will be coming in December). Also keep in mind that atlasers are reporting to the highest code observed, so later in the season, there is a bias against reporting lower-level codes.
One example of a real-world conservation outcome from this kind of information is the DNR avoidance guidelines. For rare or threatened species, the DNR is obligated to ensure habitat management isn’t harming them. In order to assess potential impacts, we need good knowledge of what birds are doing at a certain time of year. Are young out of the nest by July? August? September? This could impact when habitat management should occur at a site to reduce impacts to sensitive species.
The benefits don’t stop at rare species, however. For all Wisconsin bird species, there’s no other data source outside of the Atlas that provides breeding phenology data at a scale broader than the local level. Sure, we all make observations of when a robin might be nest building, woodcocks displaying, or goldfinches fledging, but rarely are such observations captured in a standardized form accessible to current and future scientists for understanding and conserving birds — at a statewide scale! In fact, the previous Atlas is the last time such data were assembled. Now we have the opportunity to do it again and provide both current data and the opportunity to compare results with those gathered 20 years ago.
We don’t yet have these plots for all species up on the main atlas website for you to peruse, but after we get some of the year 1 data proofed, we are considering doing so if there is interest.
Thanks to Nick Walton for assistance in making these chronology plots.